Synopsis
Data
It is now possible to collect a large amount of data about personal movement using activity monitoring devices such as a Fitbit, Nike Fuelband, or Jawbone Up. These type of devices are part of the “quantified self” movement – a group of enthusiasts who take measurements about themselves regularly to improve their health, to find patterns in their behavior, or because they are tech geeks. But these data remain under-utilized both because the raw data are hard to obtain and there is a lack of statistical methods and software for processing and interpreting the data.
This assignment makes use of data from a personal activity monitoring device. This device collects data at 5 minute intervals through out the day. The data consists of two months of data from an anonymous individual collected during the months of October and November, 2012 and include the number of steps taken in 5 minute intervals each day.
The data for this assignment can be downloaded from the course web site:
- Dataset: Activity monitoring data [52K]
The variables included in this dataset are:
-
steps: Number of steps taking in a 5-minute interval (missing values are coded as
NA) -
date: The date on which the measurement was taken in YYYY-MM-DD format
-
interval: Identifier for the 5-minute interval in which measurement was taken
The dataset is stored in a comma-separated-value (CSV) file and there are a total of 17,568 observations in this dataset.
Processing Step and Questions
- Loading and preprocessing the data
- What is mean total number of steps taken per day?
- What is the average daily activity pattern?
- Imputing missing values
- Are there differences in activity patterns between weekdays and weekends?
Loading and preprocessing the data
# Download the Data set
    fileurl <- "https://d396qusza40orc.cloudfront.net/repdata%2Fdata%2Factivity.zip"
    download.file(fileurl, destfile = 'activity.zip')

# unziping the data set
    unzip('activity.zip', exdir = '.')
# loading the data set
    data <- read.csv('activity.csv', header = T)
# Show first 10 rows in the data set
    head(data,10)
| steps | date | interval |
|---|---|---|
| NA | 2012-10-01 | 0 |
| NA | 2012-10-01 | 5 |
| NA | 2012-10-01 | 10 |
| NA | 2012-10-01 | 15 |
| NA | 2012-10-01 | 20 |
| NA | 2012-10-01 | 25 |
| NA | 2012-10-01 | 30 |
| NA | 2012-10-01 | 35 |
| NA | 2012-10-01 | 40 |
| NA | 2012-10-01 | 45 |
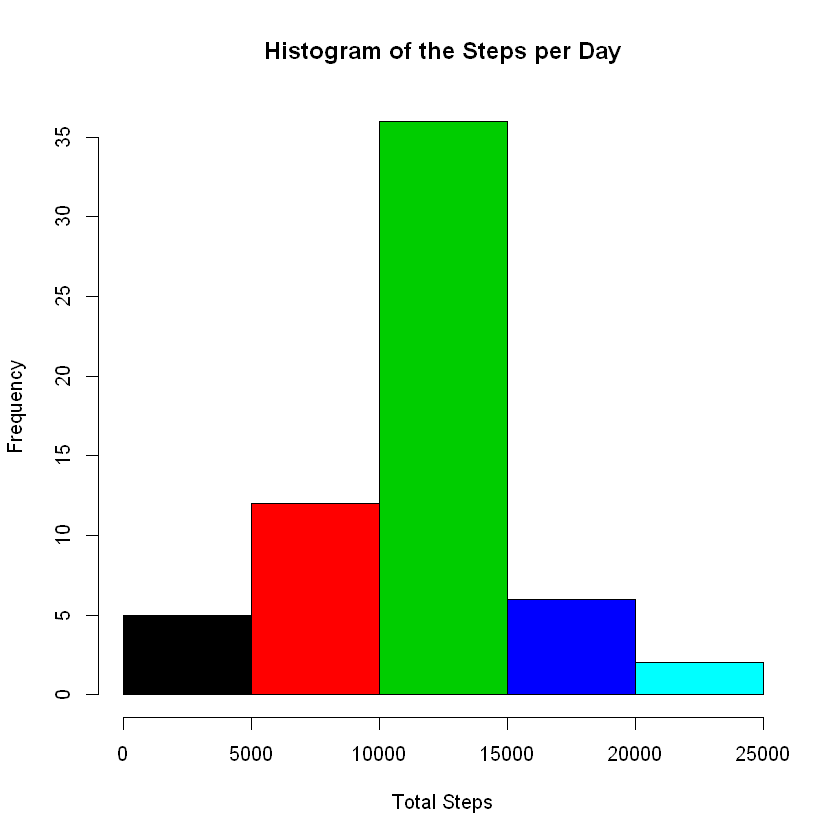
What is mean total number of steps taken per day?
# Aggregating the total number of steps taken per day
    stepByDay <- aggregate(steps ~ date, data = data, sum)
Making a histogram of the total number of steps:
hist(stepByDay$steps,
     xlab = 'Total Steps',
     main = 'Histogram of the Steps per Day',
     col = c(1,2,3,4,5))
Calculating the mean and median of the total number of steps taken per day
# calculate mean
    round(mean(stepByDay$steps, na.rm = T),2)
10766.19
# calculate median
    median(stepByDay$steps, na.rm = T)
10765
What is the average daily activity pattern?
Make a time series plot of the 5-minute interval (x-axis) and the average number of steps taken, averaged across all days (y-axis)
# Aggregating the data set
    avgStepByInterval <- aggregate(steps ~ interval,
                         data = data,
                         mean,
                         na.rm = T)
# Create time series plot
    with(avgStepByInterval,
         plot(interval,
              steps,
              type = 'l',
              main = 'Average Number of Steps per Interval',
              xlab = 'Interval',
              ylab = 'Average Number of Steps'))
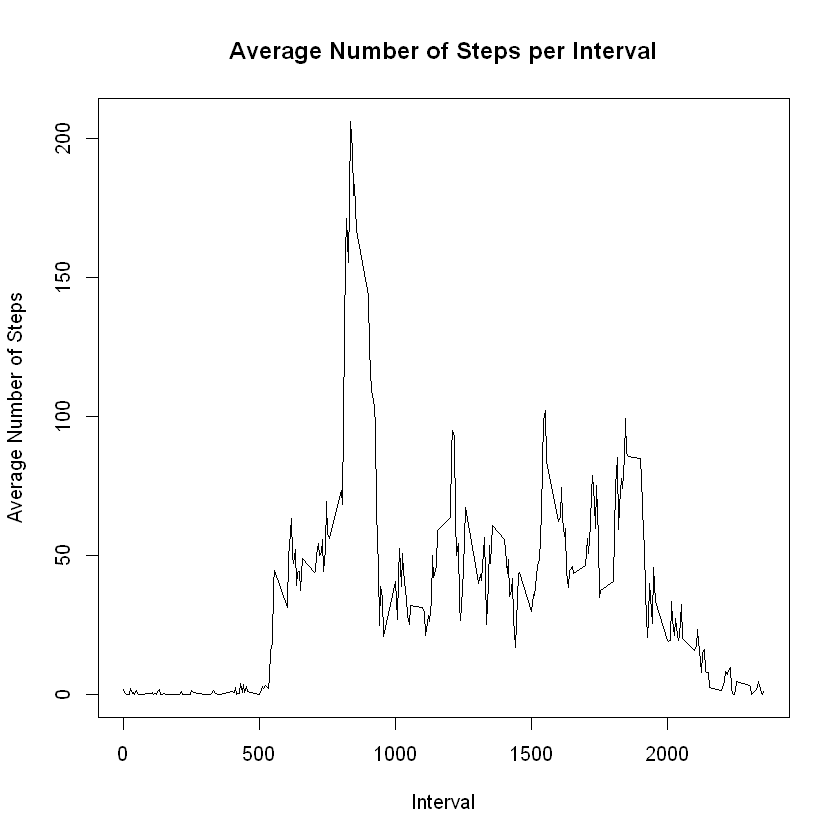
5-minute interval contains the maximum number of steps on average across all the days in the data set
# Identify maximum number of steps
    maxAverage <- max(avgStepByInterval$steps)

# Show the interval on maximum number of steps
    avgStepByInterval[avgStepByInterval$steps==maxAverage, 1]
835
Imputing missing values
Calculate and report the total number of missing values in the dat aset (i.e. the total number of rows with (NAs)
# Identify the total number of missing value
    missingValue <- sum(is.na(data$steps))

    missingValue
2304
Devise a strategy for filling in all of the missing values in the dataset. The strategy does not need to be sophisticated. For example, you could use the mean/median for that day, or the mean for that 5-minute interval, etc. Create a new dataset that is equal to the original dataset but with the missing data filled in. I’m choosing to use mean of the Total Number Steps to replace NA Value
# Create new data set from original data
    newData <- data

# Replace missing value with average
    newData$steps[is.na(newData$steps)] <- mean(data$steps, na.rm = T)
# Show the changes in first 10 rows of the new data set
    head(newData,10)
| steps | date | interval |
|---|---|---|
| 37.3826 | 2012-10-01 | 0 |
| 37.3826 | 2012-10-01 | 5 |
| 37.3826 | 2012-10-01 | 10 |
| 37.3826 | 2012-10-01 | 15 |
| 37.3826 | 2012-10-01 | 20 |
| 37.3826 | 2012-10-01 | 25 |
| 37.3826 | 2012-10-01 | 30 |
| 37.3826 | 2012-10-01 | 35 |
| 37.3826 | 2012-10-01 | 40 |
| 37.3826 | 2012-10-01 | 45 |
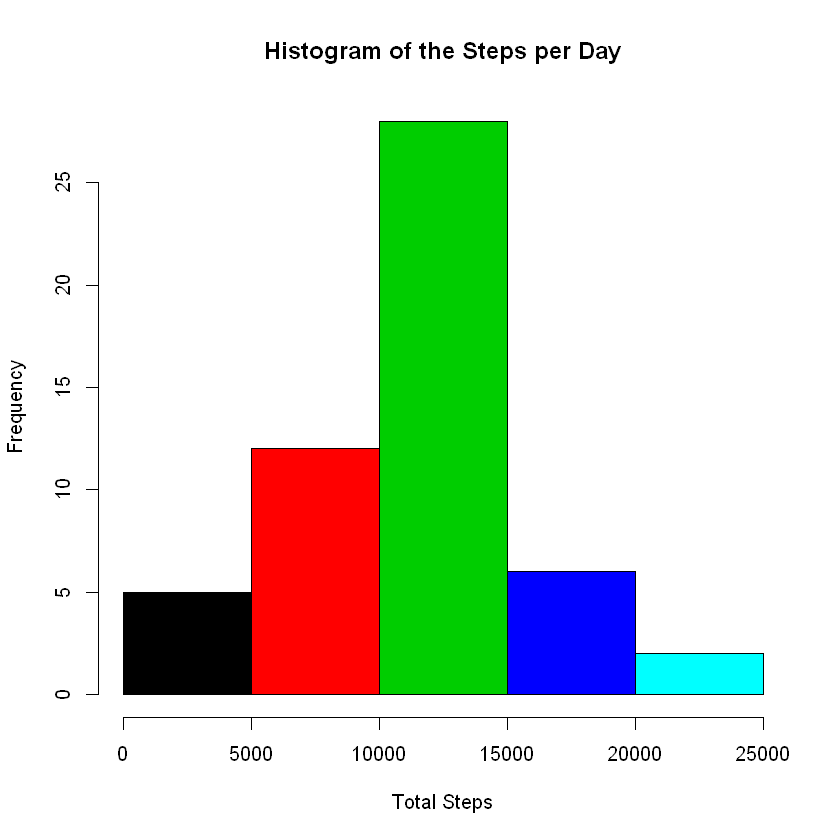
Make a histogram of the total number of steps taken each day and Calculate and report the mean and median total number of steps taken per day.
# Aggregating the total number of steps taken per day
    stepByDay <- aggregate(steps ~ date, data = newData, sum)
Making a histogram of the total number of steps:
hist(stepByDay$steps,
     xlab = 'Total Steps',
     main = 'Histogram of the Steps per Day',
     col = c(1,2,3,4,5))
# calculate mean
    round(mean(stepByDay$steps),2)
10766.19
# calculate median
    round(median(stepByDay$steps),2)
10766.19
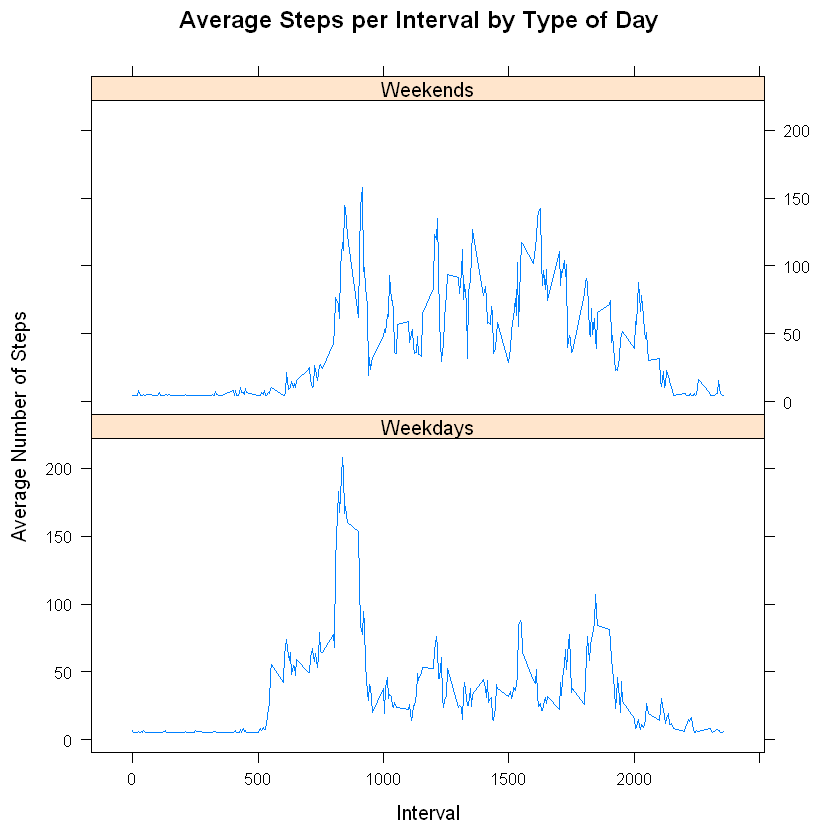
Are there differences in activity patterns between weekdays and weekends?
Create a new factor variable in the dataset with two levels – “weekday” and “weekend” indicating whether a given date is a weekday or weekend day
# Create new column dayType to indicating whether it's weekday or weekend day.
    # Detemine what day in given date
    newData$dayType <- weekdays(as.Date(newData$date))

    # Replace it with two level - "weekday" and "weekend"
    newData$dayType <- ifelse(newData$dayType %in% c('Saturday','Sunday'),'Weekends','Weekdays')
# Show the changes in first 10 rows of the new data set
    head(newData,10)
| steps | date | interval | dayType |
|---|---|---|---|
| 37.3826 | 2012-10-01 | 0 | Weekdays |
| 37.3826 | 2012-10-01 | 5 | Weekdays |
| 37.3826 | 2012-10-01 | 10 | Weekdays |
| 37.3826 | 2012-10-01 | 15 | Weekdays |
| 37.3826 | 2012-10-01 | 20 | Weekdays |
| 37.3826 | 2012-10-01 | 25 | Weekdays |
| 37.3826 | 2012-10-01 | 30 | Weekdays |
| 37.3826 | 2012-10-01 | 35 | Weekdays |
| 37.3826 | 2012-10-01 | 40 | Weekdays |
| 37.3826 | 2012-10-01 | 45 | Weekdays |
Make a panel plot containing a time series plot of the 5-minute interval (x-axis) and the average number of steps taken, averaged across all weekday days or weekend days (y-axis)
# Aggregating the total number of steps taken per day
    stepByDayType <- aggregate(newData['steps'], newData[c('interval','dayType')], mean)
# Import Necessary library
    library(lattice)

# Make time series plot
    xyplot(steps ~ interval | dayType,
           data = stepByDayType,
           type = 'l',
           layout = c(1,2),
           main="Average Steps per Interval by Type of Day",
           ylab="Average Number of Steps",
           xlab="Interval")