Synopsis
Data
Storms and other severe weather events can cause both public health and economic problems for communities and municipalities. Many severe events can result in fatalities, injuries, and property damage, and preventing such outcomes to the extent possible is a key concern.
This project involves exploring the U.S. National Oceanic and Atmospheric Administration’s (NOAA) storm database. This database tracks characteristics of major storms and weather events in the United States, including when and where they occur, as well as estimates of any fatalities, injuries, and property damage.
The data for this assignment come in the form of a comma-separated-value file compressed via the bzip2 algorithm to reduce its size. You can download the file from the course web site:
- Storm Data [47Mb]
There is also some documentation of the database available. Here you will find how some of the variables are constructed/defined.
- National Weather Service Storm Data Documentation
- National Climatic Data Center Storm Events FAQ
The events in the database start in the year 1950 and end in November 2011. In the earlier years of the database there are generally fewer events recorded, most likely due to a lack of good records. More recent years should be considered more complete.
Assignment
- Across the United States, which types of events (as indicated in the
EVTYPEvariable) are most harmful with respect to population health? - Across the United States, which types of events have the greatest economic consequences
Data Processing
- Loading data
- Downloading the data set
# Download the Data set
    fileurl <- "https://d396qusza40orc.cloudfront.net/repdata%2Fdata%2FStormData.csv.bz2"
    download.file(fileurl, destfile = 'repdata_data_StormData.csv.bz2')
- Loading the data set
First, reading data set from .bz2 file extension.
# Loading the data set
    rawData <- read.csv("repdata_data_StormData.csv.bz2", header = T)
After reading the data set, check the dimension and the column names.
# Checking the dimension of the data set
    dim(rawData)

# Checking first 5 rows of the data set
    head(rawData, 5)
902297
37
| STATE__ | BGN_DATE | BGN_TIME | TIME_ZONE | COUNTY | COUNTYNAME | STATE | EVTYPE | BGN_RANGE | BGN_AZI | ... | CROPDMGEXP | WFO | STATEOFFIC | ZONENAMES | LATITUDE | LONGITUDE | LATITUDE_E | LONGITUDE_ | REMARKS | REFNUM |
|---|---|---|---|---|---|---|---|---|---|---|---|---|---|---|---|---|---|---|---|---|
| 1 | 4/18/1950 0:00:00 | 0130 | CST | 97 | MOBILE | AL | TORNADO | 0 | ... | 3040 | 8812 | 3051 | 8806 | 1 | ||||||
| 1 | 4/18/1950 0:00:00 | 0145 | CST | 3 | BALDWIN | AL | TORNADO | 0 | ... | 3042 | 8755 | 0 | 0 | 2 | ||||||
| 1 | 2/20/1951 0:00:00 | 1600 | CST | 57 | FAYETTE | AL | TORNADO | 0 | ... | 3340 | 8742 | 0 | 0 | 3 | ||||||
| 1 | 6/8/1951 0:00:00 | 0900 | CST | 89 | MADISON | AL | TORNADO | 0 | ... | 3458 | 8626 | 0 | 0 | 4 | ||||||
| 1 | 11/15/1951 0:00:00 | 1500 | CST | 43 | CULLMAN | AL | TORNADO | 0 | ... | 3412 | 8642 | 0 | 0 | 5 |
- Subset the data set
This step is about to subset column that will be used in the data analysis. These are the column :
 - EVTYPE            : Event Type
 - FATALITIES        : Number of Fatalities
 - INJURIES          : Number of Injuries
 - PROPDMG           : Property Damages
 - PROPDMGEXP        : Units for Property Damages (Magnitude - K, B, M)
 - CROPDMG           : Crop Damages
 - CROPDMGEXP        : Units for Property Damages (Magnitude - K, B, M)
# Subsetting the data set
    data <- rawData[,c("EVTYPE", "FATALITIES", "INJURIES", "PROPDMG", "PROPDMGEXP", "CROPDMG", "CROPDMGEXP")]
- Data Re-formatting
Event Type
If we see the content of EVTYPE variable, it shown that the type of climate too detailed in explain every event. It differentiated some event that basically has same characteristics. For example, “TSTM WIND”, “HIGH WIND”. “THUNDERSTORM WIND” and so forth. So, I used several categories of climate type to make it more simple.
# Assign categories in old and new objects
    old <- c("WIND", "RAIN", "FLOOD", "STROM|STORM", "HAIL|BLIZZARD", "HEAT", "SNOW", "COLD|ICE|FREEZE|FROST", "WINTER", "WILD", "FOG", "LIGHTNING", "DRY|DROUGHT", "TORNADO|HURRICANE")
    new <- c("WIND", "RAIN", "FLOOD", "STORM", "BLIZZARD", "HEAT","SNOW", "FROST", "WINTER", "WILDFIRE", "FOG", "LIGHTNING", "DROUGHT", "TORNADO")
# Replacing EVTYPE with assigned categories
    for (i in 1:14){
        data$EVTYPE[grep(old[i], data$EVTYPE, ignore.case = T)] <- new[i]
    }
Units of Property Damages & Crop Damages
Units of Property & Crop Damages are the damages of every type of event caused. These damages are represented the amount of money in dollars. The magnitudes of the damages measured by 3 type, which is K (per 1000), M (per 1000 000) and B (per 1000 000 000)
# Assign types of measurement in old and new objects
    old <- c("K|M|B", "K", "M", "B")
    new <- c(0, 10^3, 10^6, 10^9)
# Replacing value of PROPDMGEXP and CROPDMGEXP variable
    data$PROPDMGEXP[!grepl(old[1], data$PROPDMGEXP, ignore.case = T)] <- new[1]
    data$CROPDMGEXP[!grepl(old[1], data$CROPDMGEXP, ignore.case = T)] <- new[1]

    for (i in 2:4){
        data$PROPDMGEXP <- gsub(old[i], new[i], data$PROPDMGEXP, ignore.case = T)
        data$CROPDMGEXP <- gsub(old[i], new[i], data$CROPDMGEXP, ignore.case = T)
    }
# Converting PROPDMGEXP and CROPDMGEXP to numeric
    data$PROPDMGEXP <- as.numeric(data$PROPDMGEXP)
    data$CROPDMGEXP <- as.numeric(data$CROPDMGEXP)
- Across the United States, which types of events (as indicated in the EVTYPE variable) are most harmful with respect to population health?
Processing data from the used data set is important. So, the data set need to be subsetted, in order to make the data more easy to analysed. According to the question, the answer only required 3 Column which are EVTYPE, FATALITIES and INJURIES.
# Making a new data set consist of 3 variable, which are EVTYPE, FATALITIES, and INJURIES
    eventHealth <- aggregate(data[c("FATALITIES", "INJURIES")], data["EVTYPE"], sum)
# Arrange the type of event based on INJURIES
    eventHealth <- eventHealth[order(eventHealth$INJURIES, decreasing = T),]

# Subset the top 10 observations in the arranged data set
    eventHealth <- head(eventHealth, 10)
eventHealth
| EVTYPE | FATALITIES | INJURIES | |
|---|---|---|---|
| 238 | TORNADO | 5769 | 92735 |
| 289 | WIND | 1451 | 11498 |
| 62 | HEAT | 3138 | 9224 |
| 41 | FLOOD | 1524 | 8604 |
| 102 | LIGHTNING | 817 | 5231 |
| 15 | BLIZZARD | 116 | 2177 |
| 288 | WILDFIRE | 90 | 1606 |
| 169 | SNOW | 159 | 1120 |
| 42 | FOG | 80 | 1076 |
| 49 | FROST | 225 | 445 |
# Reformatting new data set
    # 1. Fatalities
        # Subsetting the data set to only show EVTYPE and FATALITIES variable
            fatalities <- eventHealth[-3] # exclude INJURIES variable
        # Change colnames FATALITIES to total
            colnames(fatalities)[2] <- "Total"
        # Add new column Type with vales "Fatalities" to identify total fatalities
            fatalities$Type <- "Fatalities"

    # 2. Do the same thing to INJURIES variable
        injuries <- eventHealth[-2] # exclude FATALITIES variable
        colnames(injuries)[2] <- "Total"
        injuries$Type <- "Injuries"

    # 3. Merge both FATALITIES and INJURIES data set into one object
        eventHealth <- rbind(fatalities, injuries)
eventHealth
| EVTYPE | Total | Type | |
|---|---|---|---|
| 238 | TORNADO | 5769 | Fatalities |
| 289 | WIND | 1451 | Fatalities |
| 62 | HEAT | 3138 | Fatalities |
| 41 | FLOOD | 1524 | Fatalities |
| 102 | LIGHTNING | 817 | Fatalities |
| 15 | BLIZZARD | 116 | Fatalities |
| 288 | WILDFIRE | 90 | Fatalities |
| 169 | SNOW | 159 | Fatalities |
| 42 | FOG | 80 | Fatalities |
| 49 | FROST | 225 | Fatalities |
| 2381 | TORNADO | 92735 | Injuries |
| 2891 | WIND | 11498 | Injuries |
| 621 | HEAT | 9224 | Injuries |
| 411 | FLOOD | 8604 | Injuries |
| 1021 | LIGHTNING | 5231 | Injuries |
| 151 | BLIZZARD | 2177 | Injuries |
| 2881 | WILDFIRE | 1606 | Injuries |
| 1691 | SNOW | 1120 | Injuries |
| 421 | FOG | 1076 | Injuries |
| 491 | FROST | 445 | Injuries |
- Across the United States, which types of events have the greatest economic consequences?
According to the question, the answer only require 5 Column which are EVTYPE, PROPDMG, PROPDMGEXP, CROPDMG and CROPDMGEXP.
# Making new data set for examine the economic consequences
    eventEconomy <- data[, -(2:3)] # Excluding FATALITIES and INJURIES variable

# Make some variable to examine the Damages variable
    library(dplyr)
    eventEconomy <- eventEconomy %>% select(everything()) %>% mutate(PROPTTLDMG = PROPDMG * PROPDMGEXP,
                                          CROPTTLDMG = CROPDMG * CROPDMGEXP,
                                          TOTALDMG = PROPTTLDMG + CROPTTLDMG) %>% select(EVTYPE, PROPTTLDMG, CROPTTLDMG, TOTALDMG)
# Subset the data set to show ONLY EVTYPE and Total Damage variables
    eventEconomy <- aggregate(eventEconomy[-1], eventEconomy[1], sum)

# Arrange the type of event based on TOTALDMG
    eventEconomy <- eventEconomy[order(eventEconomy$TOTALDMG, decreasing = T),]

# Subset the top 10 observations in the arranged data set
    eventEconomy <- head(eventEconomy, 10)
eventEconomy
| EVTYPE | PROPTTLDMG | CROPTTLDMG | TOTALDMG | |
|---|---|---|---|---|
| 41 | FLOOD | 167507743320 | 12266906100 | 179774649420 |
| 238 | TORNADO | 141649277690 | 5920254110 | 147569531800 |
| 289 | WIND | 17742574470 | 2159304450 | 19901878920 |
| 15 | BLIZZARD | 16397406670 | 3158897450 | 19556304120 |
| 30 | DROUGHT | 1052838600 | 13972581000 | 15025419600 |
| 288 | WILDFIRE | 8491563500 | 402781630 | 8894345130 |
| 131 | RAIN | 3262721190 | 806505800 | 4069226990 |
| 49 | FROST | 156667950 | 3406177350 | 3562845300 |
| 169 | SNOW | 1009919740 | 134663100 | 1144582840 |
| 102 | LIGHTNING | 933689280 | 12092090 | 945781370 |
# Reformatting new data set
    # 1. Properties
        # Subsetting the data set to only show EVTYPE and PROPTTLDMG variable
            property <- eventEconomy[c(1,2)]
        # Change colnames PROPTTLDMG to damage
            colnames(property)[2] <- "Damage"
        # Add new column Type with vales "Fatalities" to identify total fatalities
            property$Type <- "Property"

    # 2. Do the same thing to CROPTTLDMG variable
        crop <- eventEconomy[c(1,3)]
        colnames(crop)[2] <- "Damage"
        crop$Type <- "Crop"

    # 3. Merge both FATALITIES and INJURIES data set into one object
        eventEconomy <- rbind(property, crop)
eventEconomy
| EVTYPE | Damage | Type | |
|---|---|---|---|
| 41 | FLOOD | 167507743320 | Property |
| 238 | TORNADO | 141649277690 | Property |
| 289 | WIND | 17742574470 | Property |
| 15 | BLIZZARD | 16397406670 | Property |
| 30 | DROUGHT | 1052838600 | Property |
| 288 | WILDFIRE | 8491563500 | Property |
| 131 | RAIN | 3262721190 | Property |
| 49 | FROST | 156667950 | Property |
| 169 | SNOW | 1009919740 | Property |
| 102 | LIGHTNING | 933689280 | Property |
| 411 | FLOOD | 12266906100 | Crop |
| 2381 | TORNADO | 5920254110 | Crop |
| 2891 | WIND | 2159304450 | Crop |
| 151 | BLIZZARD | 3158897450 | Crop |
| 301 | DROUGHT | 13972581000 | Crop |
| 2881 | WILDFIRE | 402781630 | Crop |
| 1311 | RAIN | 806505800 | Crop |
| 491 | FROST | 3406177350 | Crop |
| 1691 | SNOW | 134663100 | Crop |
| 1021 | LIGHTNING | 12092090 | Crop |
Result & Conclusions
- Across the United States, which types of events (as indicated in the EVTYPE variable) are most harmful with respect to population health?
These question can be answered by comparing the total number of both fatalities and injuries in several type of Event.
# Import necessary library
    library(ggplot2)

# Create plot with eventHealth object
    ggplot(eventHealth, aes(x = reorder(EVTYPE, -Total), y = Total, fill = Type)) +
            facet_wrap(Type~., scales = "free") +
            geom_bar(stat = 'identity') +
            ggtitle("Health Impact in US based on top 10 Weather Events") +
            xlab('Type of Weather') + ylab("Number of Health Impact") +
            theme(axis.text.x = element_text(angle = 45, hjust = 1))
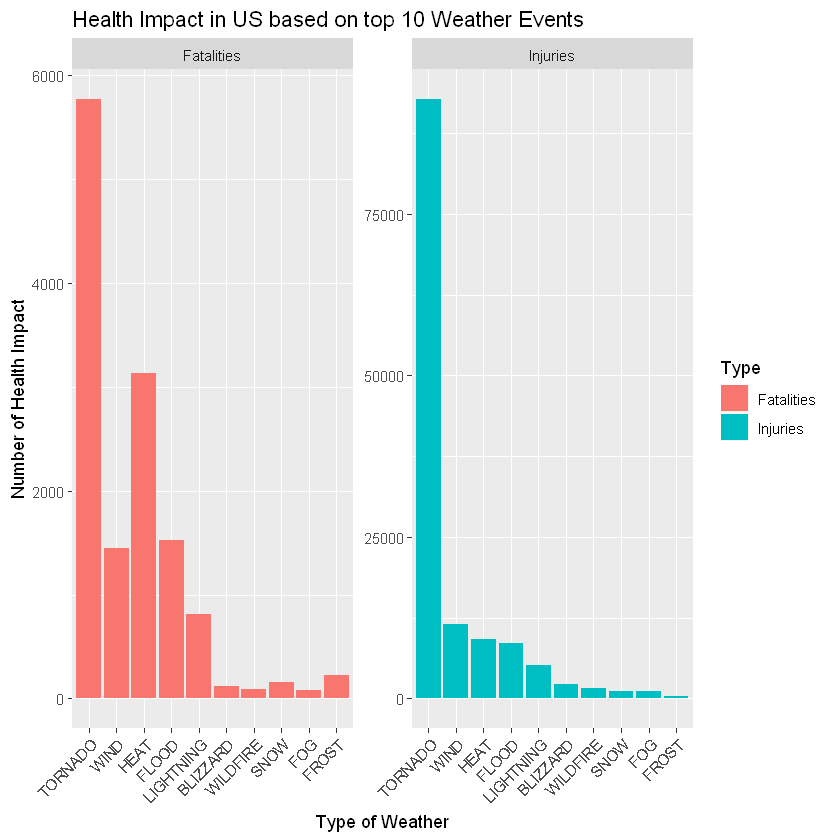
From the graph above, I conclude that Tornado has big impact into population health, both in injuries or fatalities, Across United States.
- Across the United States, which types of events have the greatest economic consequences?
These question can be answered by comparing the total damages caused by every type Weather event. These total damages indicated by the total money are used to repair both property or crop.
# Create plot with eventEconomy object
    ggplot(eventEconomy, aes(x = reorder(EVTYPE, -Damage), y = Damage/10^6, fill = Type)) +
            facet_wrap(Type~., scales = "free") +
            geom_bar(stat = 'identity') +
            ggtitle("Comparing Property and Crop Total Damages in US\n based on top 10 Weather Events") +
            xlab("Type of Weather") +
            ylab(expression("Total Damages per 10"^6* " Dollars")) +
            theme(axis.text.x = element_text(angle = 45, hjust = 1))
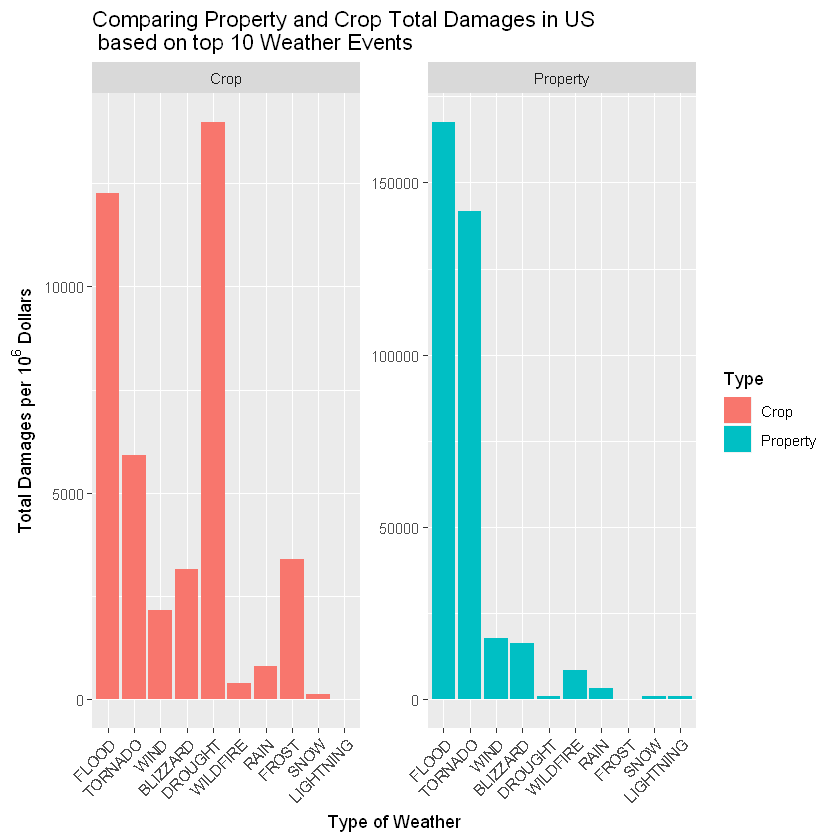
From the graph above, I conclude that the Weather event categoried by DROUGHT have the greatest repair cost in Crop Repair. While in property, We could see that the greatest cost is event categoried by FLOOD.